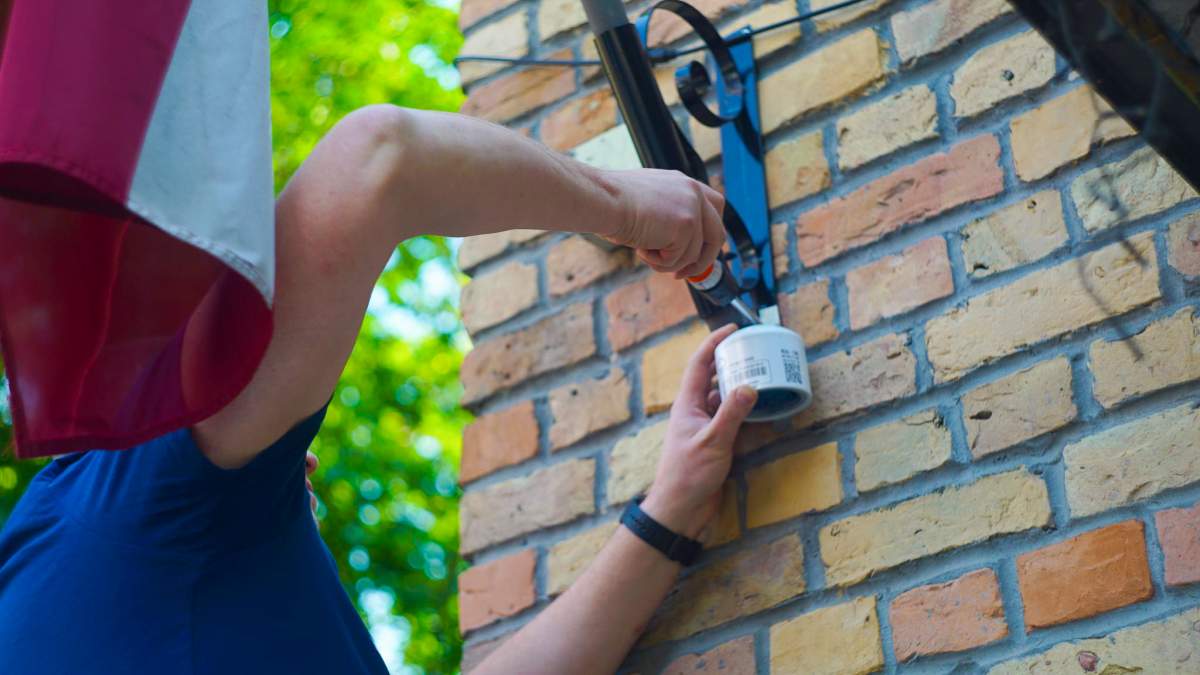
Thanks to the involvement of residents, educational institutions and organisations, 20 air quality sensors were installed across several central neighbourhoods of Riga. The sensors have been collecting air quality data for more than a year, providing valuable insights into air quality across different parts of the city.
This article summarises the results of the 2024-2025 monitoring campaign carried out within the Urban ReLeaf project and highlights air quality trends observed across different parts of the city.
Understanding PM2.5 and its impact
PM2.5 refers to fine particulate matter with a diameter of less than 2.5 micrometres. These particles are produced by a range of sources, including road traffic, residential heating, industrial activities and other combustion processes. Because of their extremely small size, PM2.5 particles can penetrate deep into the lungs and enter the bloodstream, making them one of the most significant air pollution risks to human health.
As PM2.5 pollution is invisible to the naked eye, regular monitoring is essential for understanding where residents are exposed to higher pollution levels and identifying the factors that influence air quality.
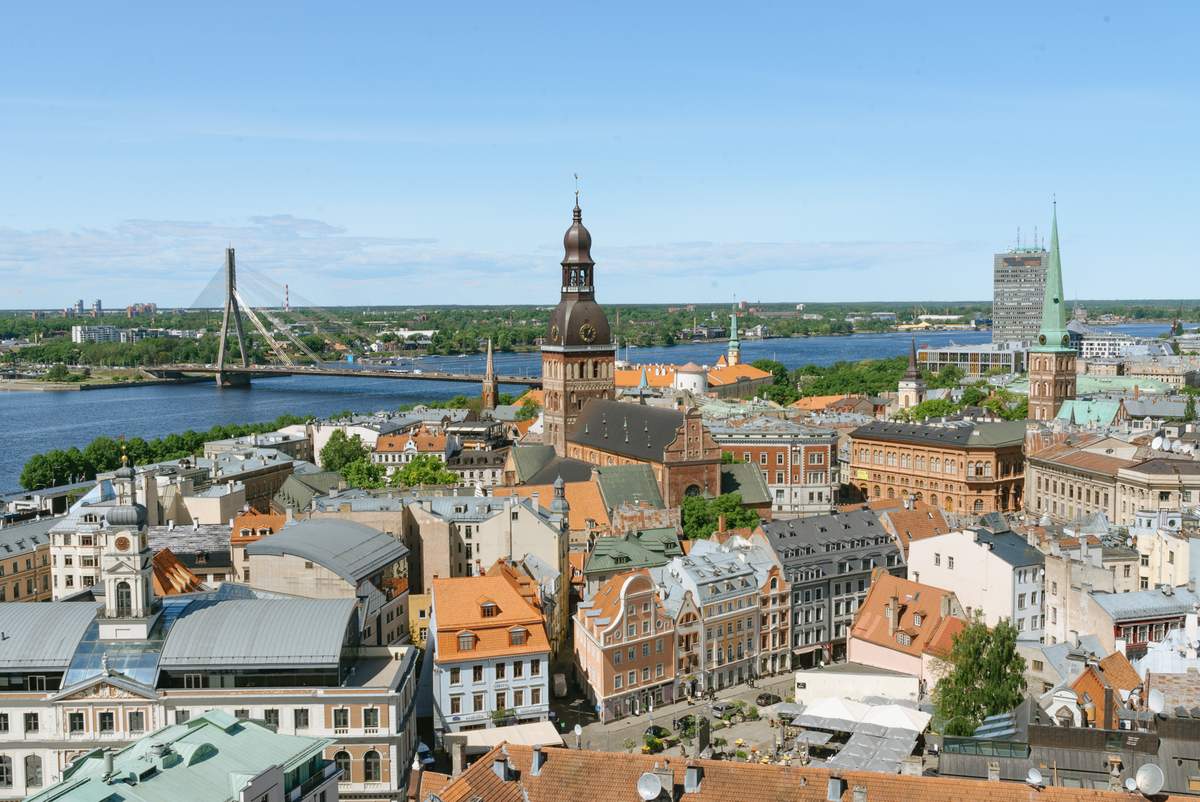
Residents, schools and universities contribute to monitoring efforts
The Urban ReLeaf monitoring campaign followed a citizen science approach, involving local residents, schools, universities, kindergartens and other organisations that responded to the call to participate in the project.Air quality sensors were installed at participating locations across the city, with several additional sensors placed in Riga’s public parks in cooperation with Rīgas meži Ltd.
The main objective of the monitoring campaign was to better understand how different urban environments influence air quality, with a particular focus on the role of green infrastructure. To explore this, sensors were deployed in four types of locations: directly adjacent to busy roads (T), near traffic corridors (NT), in green areas (G), and near green areas (NG).
This approach provided a more detailed picture of air quality patterns across central Riga than had previously been possible. Before the campaign PM2.5 levels were measured at just two official monitoring stations in the city.
The monitoring methodology, sensor calibration and data analysis were provided by Urban ReLeaf project partners from the National Observatory of Athens. Riga Municipality supported the development of the monitoring network by installing one of the sensors next to an official air quality monitoring station, enabling comparisons between low-cost sensor measurements and reference monitoring data. During the project, monitoring data were also integrated into the municipal data infrastructure in cooperation with the Riga Digital Agency.
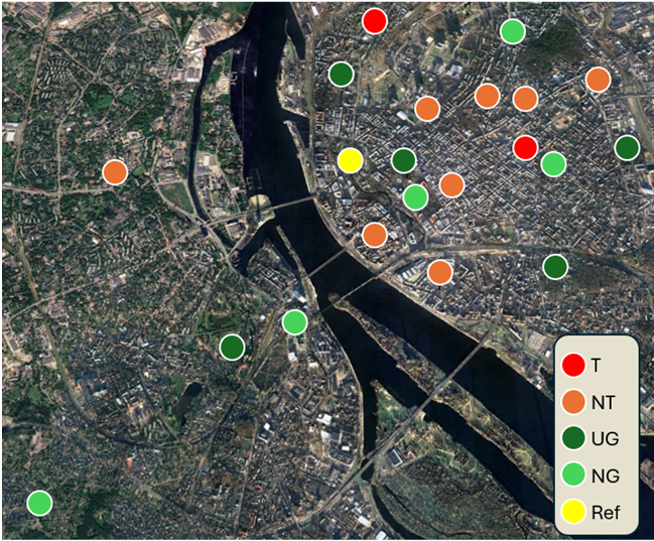
PM2.5 sensor network in Riga
What do the monitoring results show?
The analysis confirmed that PM2.5 concentrations vary across different parts of Riga, with higher concentrations more frequently observed at locations influenced by traffic. However, elevated concentrations were also recorded at some monitoring sites classified as green areas.
These differences can partly be explained by the specific location of each sensor and the influence of the surrounding urban environment. For example, sensors installed in parks were mounted on utility buildings where electricity and internet access were available, rather than in the centre of the parks themselves. As a result, measurements could also be influenced by nearby buildings, traffic and other local pollution sources.
Although none of the monitoring locations exceeded the annual PM2.5 limit value currently in force in the European Union, the results highlight potential future challenges. Under the revised EU Ambient Air Quality Directive adopted in 2024, the annual PM2.5 limit value will be reduced to 10 μg/m³ from 2030 onwards. Urban ReLeaf monitoring data show that this threshold is already being reached or exceeded at several locations in Riga.
The highest annual average concentration was recorded on Čaka Street, while locations on Slokas Street, Purvīša Street, Uzvaras Park and Kantora Street also exceeded or came very close to the future limit value.
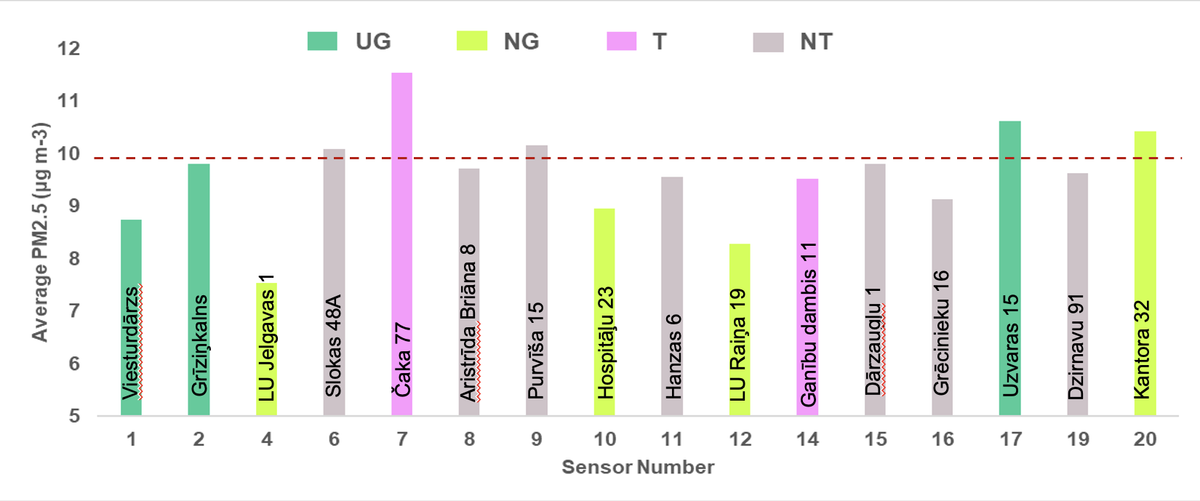
Annual average PM2.5 concentration
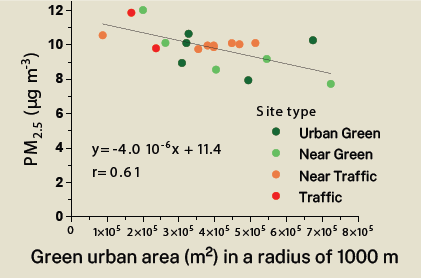
When all monitoring locations were analysed together, one of the project’s most important findings emerged: the greater the proportion of green and natural areas within a 1 km radius of a sensor, the lower the average PM2.5 concentration recorded.
This statistically significant relationship provides further evidence that green infrastructure can help reduce exposure to fine particulate pollution. The findings reinforce the importance of protecting existing greenspaces and expanding green infrastructure as part of efforts to improve air quality and create healthier urban environments.
Seasonal Changes in PM2.5 Levels
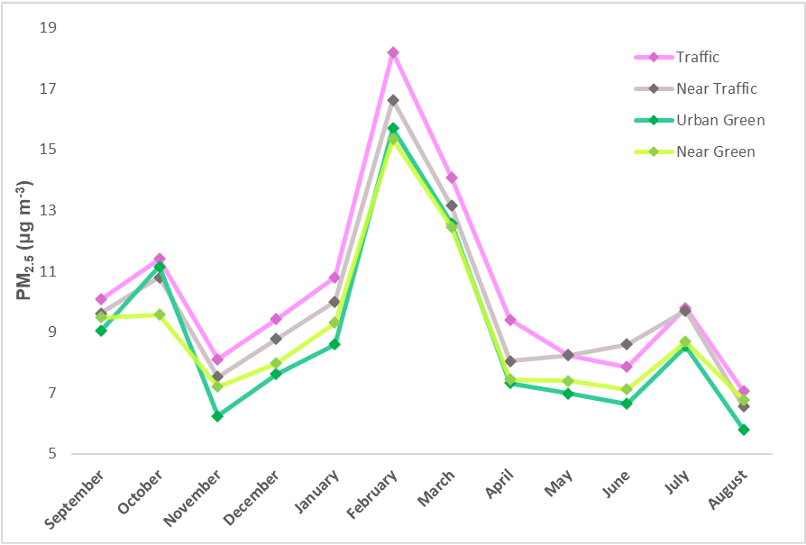
The monitoring campaign also revealed clear seasonal differences in PM2.5 concentrations. During winter months, concentrations increased at several locations during the evening hours. This pattern can be linked to the heating season and suggests that, alongside traffic emissions, residential heating practices and fuel types used continue to have a significant impact on air quality in Riga.
Differences in monthly average pollution levels
The data remains available today
The data collected through the campaign remain available to view online, allowingresidents and other interested stakeholders to explore air quality acorss Riga. Real-time data makes it possible to observe how weather conditions, traffic intensity, the heating season and other factors affect air quality across different parts of Riga.
More information and live monitoring data are available through the